


Publication | Author | Date |
Paradise dam preparedness review- report 1: 2019-20 (PDF, 11.3 MB) | Office of the Inspector-General Emergency Management | 23/12/2019 |
QLD Government response to IGEM paradise dam preparedness report (PDF, 648 KB) | Queensland Government | 23/12/2019 |
Attachment J - paradise dam community survey (PDF, 3.21 MB) | Office of the Inspector-General Emergency Management | 23/12/2019 |
DIY Using sandbags to protect your home and business (PDF, 18.5 MB) | State Emergency Service | 11/11/2021 |
State Earthquake Risk Assessment (PDF, 8.88 MB) | Queensland Fire and Emergency Services | 31/07/2019 |
Tsunami Guide for Queensland (PDF, 5.72 MB) | Queensland Fire and Emergency Services | 31/07/2019 |
Publications
|
The Queensland Disaster Management 2016 Strategic Policy Statement (the Statement) was endorsed by the Queensland Disaster Management Committee in November 2016.
The Statement's purpose is to inform the Queensland Government's strategic approach to keeping people safe and making communities more resilient to disaster risks and impacts.
The Statement meets the requirements for the Strategic Policy Framework as set out in the Disaster Management Act 2003 and referenced in the Queensland State Disaster Management Plan .
The Royal Commission into National Natural Disaster Arrangements (RCNNDA) was established on 20 February 2020 to examine natural disaster management arrangements and the legal framework for Federal Government involvement in responding to national emergencies. The Queensland Government actively and fully participated in the RCNNDA, providing eight state witnesses over nine days and almost 30,000 pages of material.
After comprehensive consideration of many complex and difficult issues, the RCNNDA final report made 80 recommendations focused on improvements to national preparedness, mitigation, response and recovery.
The RCNNDA final report, which was tabled in Federal Parliament on 30 October 2020, acknowledged the many positive unique features of the well-tested Queensland Disaster Management Arrangements, including the recovery leadership taken by the Queensland Reconstruction Authority and improvements delivered through the independent Inspector-General Emergency Management.
The Queensland Government subsequently supported or supported in-principle all recommendations either directed at state and territory governments, or requiring involvement from state and territory governments, with the exception of recommendation 21.2 (a single national approach to fundraising laws) which was 'noted'.
Implementation of RCNNDA recommendations is ongoing and the Queensland Government continues to work closely with our partners in government and non-government agencies to improve outcomes for Queenslanders and Australians when it comes to preparing for, responding to, and recovering from natural disasters.
The Queensland Government released its fifth progress report on 20 February 2024, with 33 recommendations now delivered.
Many of the recommendations require national collaboration on complex, long-term projects, such as operational communications and national interoperability, all-hazard warnings, disaster risk information and data sharing. Queensland is working with the Australian, state and territory governments through national working groups and the National Emergency Management Ministers Meeting to deliver these reforms.
Queensland Government Response to the RCNNDA (PDF, 313 KB)
Queensland Government Implementation Progress Report 2021 (PDF, 322 KB)
Queensland Government's Second Implementation Progress Report - May 2022 (PDF, 364 KB)
Queensland Government's Third Implementation Progress Report - November 2022 (PDF, 149 KB)
Queensland Government's Fourth Implementation Progress Report - July 2023
Queensland Government's Fifth Implementation Progress Report - January 2024
SDCC Annual Report 2020-2021 (PDF, 2,1 MB)
SDCC Annual Report 2019-2020 (PDF, 1.6 MB)
SDCC Annual Report 2018-2019 (PDF, 3.8 MB)
SDCC Annual Report 2017-2018 (PDF, 1.68 MB)
SDCC Annual Report 2016-2017 (PDF, 1.03 MB)
SDCC Annual Report 2015-2016 (PDF, 1.25 MB)
These reports highlight disaster management activities undertaken during the relevant financial year together with details of disaster operations and information about priorities for disaster management.
Queensland Disaster Management Committee Annual Report 2020-2021
Queensland Disaster Management Committee Annual Report 2019-2020
Queensland Disaster Management Committee Annual Report 2018-2019
Queensland Disaster Management Committee Annual Report 2017-2018
Queensland Disaster Management Committee Annual Report 2016-2017
Queensland Disaster Management Committee Annual Report 2015-2016
Queensland Disaster Management Committee Annual Report 2014-2015
Business continuity planning resource - for aged care facilities
Business continuity planning and response checklist for residential aged care facilities
Keeping Our Mob ClimateSafe Fact Sheet *
DIY Using sandbags to protect your home and business
Emergency REDiPlan: Household preparedness for people with a disability, their family and carers.
Queensland Government Aboriginal and Torres Strait Islander Cultural Capability Training Strategy
Tropical Cyclone Storm Tide Warning - Response System Handbook (12th Edition)
Disaster Management Reviews
From November 2014 through to May 2015 Queensland endured several significant weather events – including Severe Tropical Cyclone Marcia, Tropical Cyclones Nathan and Lam, as well as their devastating effects such as the related flooding in the Callide Valley.
Five key government agencies undertook six evaluations seeking to improve disaster responses.
Additionally, the Inspector-General, Emergency Management (IGEM), a role established in 2013 to provide assurance of public safety in the area of disaster and emergency management, undertook a further five reviews. These reviews and their recommendations are available on the IGEM Reviews and Reports page.
These evaluations resulted in 160 recommendations and of these recommendations, 103 (65%) have already been delivered and as a result, Queensland was well placed to respond swiftly to recent disaster events. Improvements include:
- A new Immediate Hardship Assistance—Essential Services grant, for people who have lost one or more essential services, such as power, for more than five days. A $150 grant is available per person or up to $750 for a family of five or more.
- An online grants portal for people experiencing immediate personal hardship following a disaster, is currently in development. This will allow people who have been impacted by a disaster to apply, be assessed and receive payments direct to their bank account without having to queue for hours at a recovery centre.
- A revision of roles and responsibilities, with Queensland Reconstruction Authority now coordinating whole-of-government disaster recovery, resilience and mitigation policy including flood risk management.
- The creation of a standing state recovery coordination role, to be filled by an existing senior executive officer. This role will facilitate better coordination of recovery planning and preparations across the range of agencies involved in the long term recovery of individuals and communities impacted by disasters.
Remaining recommendations will be progressively implemented over the coming months, taking note of lessons learned from Severe Tropical Cyclone Debbie.
Further information is available by clicking on the links below:
|
The Community Recovery Review identified opportunities to continue to improve Community Recovery operations across three key domains: roles and responsibilities, information and processes, and workforce and capability.
The Queensland Government is well progressed with implementation of review recommendations and has already delivered improvements to interoperability with recovery partner organisations, communications capabilities and increased use of ICT devices in the field to ensure community recovery services are contemporary and efficient.
Work is continuing, and in some cases will be ongoing in the areas of information and communications technology, intelligence and planning, and capability building.
You can access the Community Recovery Review here .
The purpose of the Review of the Queensland Disaster Relief and Recovery Guidelines was to evaluate the provisions for immediate hardship assistance following Severe Tropical Cyclone Marcia in February 2015.
The review recommended changes to the Guidelines to make immediate eligibility restrictions less onerous, to provide a more flexible timeframe for delivery of immediate hardship assistance, and to permit scaling of immediate hardship assistance measures so that additional assistance could be provided should an extended loss of services (electricity, water, gas or sewerage) occur as a result of a natural disaster.
All review recommendations have been delivered.
You can access the Review of the Queensland Disaster Relief and Recovery Guidelines here .
The purpose of the Queensland Reconstruction Authority Operational Review was to assess the effectiveness of the Authority's operations since its commencement in 2011, to better inform the future role and operations of the Authority, and to support its transition from a temporary to permanent agency within the Queensland disaster management framework.
The Review found that the Authority was seen as a trusted and reliable advisor that had effectively performed its core functions, as well as undertaken a number of initiatives to address identified needs and service gaps within the disaster management cycle.
The Review recommended that the Authority's roles and responsibilities in the Queensland disaster management framework be clarified, that the Authority have a defined role in established disaster management committees, core functions be retained including those of Commonwealth funding negotiations and relief and recovery arrangements, capacity building work be undertaken and the Authority take a lead sponsorship role in state-wide disaster resilience, mitigation and risk-based planning.
The Queensland Government has delivered the majority of the review recommendations – the flexibility and scalability of the Authority has been retained through its preservation as a statutory authority and maintenance of core functions and actions have been taken to strengthen the role of the Authority in state-wide disaster resilience, mitigation and risk-based planning.
Queensland Reconstruction Authority Operational Review (PDF, 5 MB)
The Report into Aspects of Response and Recovery Initiatives (TC Marcia & TC Nathan) recommended an improved recovery management framework, formal protocols on the transition from response to recovery including the appointment of a State Recovery Coordinator, enhancing interoperability of information systems between agencies and division of responsibility for strategic decision making and governance.
Queensland Government agencies engaged in response and recovery activities are progressing with implementing the recommendations of the report.
Report into Aspects of Response and Recovery Initiatives (TC Marcia & TC Nathan) (PDF, 428 KB)
The purpose of the Performance Review of the Flood Warning Gauge Network in Queensland was to evaluate the adequacy of the hydrometric gauge networks used for flood warning in Queensland in order to identify and prioritise potential areas of improvement.
The Performance Review found that gauging stations of varying technical standards had resulted in the reliability of data used for flood forecasting and warnings being of variable quality. There were no consistently applied standards for instrumentation, monitoring and data collection for gauges used for flood warning.
Queensland Government agencies are on track to implement the recommendations of the report focussing initially on local councils with very high and high priority settlements identified for improved flood warning infrastructure. Implementation includes validation of the outcomes of the state wide review with respective local councils and the formation of a cross-agency forum to oversee improvements in the strategic and operational arrangements of the Queensland flood warning gauge network.
The Review of Flood Risk Management Arrangements in Queensland specifically examines arrangements for the delivery, coordination and governance of flood risk management activities by Queensland Government agencies.
The Review found that while flood risk management arrangements are outlined in various legislation, policy and administrative frameworks, a gap exists in overarching strategic policy and governance arrangements, coordination of activities and approaches to activities across agencies.
Queensland Government agencies are on track to implement the recommendations of the report including the development of strategic flood risk management policy, robust governance arrangements and a systematic approach to catchment-wide investigations.
Review of Flood Risk Management Arrangements in Queensland (PDF, 1 MB)
The purpose of the Review of Cyclone and Storm Tide Sheltering Arrangements was to examine cyclone and storm tide sheltering arrangements across Queensland.
The Review found that some local governments exposed to storm tides have not undertaken risk modelling and do not have storm tide evacuation zones. Where risk modelling had been undertaken and evacuation zones mapped, inconsistencies were found that could lead to confusion during evacuations, particularly along local government borders.
Residual risks, particularly for extreme events, were often not adequately identified; nor was there a consistent method to transfer risks. Further, residual risks were not collated at the state level to inform state agencies' capability planning. As risk was not always adequately identified and assessed it could not be determined if sheltering arrangements match risk. Additionally, detailed information about the communities' reliance on public sheltering was not always known.
Local and district disaster management groups would benefit from clear guidance on how to identify and engage vulnerable people during emergencies. Opportunities existed to review a number of guidelines to improve consistency and promote scalability for events and the capacity of local government. There was evidence of mixed messages and a lack of coordination between agencies to deliver comprehensive and consistent all-hazards messaging that supports local context.
Queensland Government agencies are on track to implement the recommendations of the report including development of state-wide engagement strategies to ensure consistent community messaging and identification of vulnerable people in emergencies, guidance to local government on disaster management doctrine, and a risk-based approach to disaster management planning.
The purpose of the Review of State Agency Integration at a Local and District Level was to describe the drivers for, and barriers to, integration of state government agencies in Queensland's disaster management arrangements.
The Review found significant challenges compromising effective integration and consequently, opportunities for improvement.
Better definition of roles and responsibilities across Queensland's disaster management arrangements would support agencies' ability to integrate with district and local disaster management. Clarification of functions could guide entities to integrate arrangements at all levels.
The Queensland government has committed to reviewing disaster management arrangements to develop a coordinated and collaborative approach to disaster management planning. This will enhance integration and guidance on a risk-based disaster management planning process for state, district and local agencies and provide for better assessment of capacity and capability, and improved integration.
Review of State Agency Integration at a Local and District level
The Review of Local Government's Emergency Warning Capability assessed the capability of local government in Queensland to issue contextualised, fit-for-purpose, consistent and accurate warnings through all phases of an event.
The Review found that few local governments had undertaken sufficient planning to profile their communities and identify barriers to effective communication. As a result, warnings may not be issued effectively and communities may not understand the warnings or know what action to take during a disaster. Devolved responsibility for warnings to the local level had occurred without adequate centralised support through disaster management arrangements.
A disconnect between state-wide approaches, arrangements and disaster management doctrine restricted the capacity of local government to give effective warnings to communities. Warning systems and arrangements do not allow for the continuous flow of critical, up-to-date and relevant information between stakeholders and legislation and doctrine conflicts at times and lacks clarity of roles and responsibilities for the delivery of emergency warnings.
There was evidence of goodwill and effort dedicated to achieving consistent messaging, but current doctrine did not provide sufficient clarity on responsibilities. Nor is there adequate governance to integrate the approaches of state and local government in relation to communication and warnings.
The majority of the recommendations have been delivered, with further work to be undertaken by Queensland government agencies to evaluate the effectiveness of warnings and further develop guidelines.
The Callide Creek Flood Review Report presents the findings of a comprehensive review conducted by the Inspector-General Emergency Management, into the events associated with the impact of Tropical Cyclone Marcia in the Callide Valley area. Particular attention was given to flooding that occurred downstream of the Callide Dam, and the operation of the Dam. The report also provides commentary on flooding events in other catchments at the time and the cumulative effect this had at various locations.
The review considered the disaster management actions undertaken in relation to this event and made recommendations designed to enhance the safety and well-being of affected communities in the future. The review revealed systemic difficulties, particularly in relation to warnings and education, highlighted the complexities of disaster management and the need for thorough and proper planning, preparation and practicing of those arrangements.
The majority of the recommendations of this review have been delivered, including improved public education, completion of business continuity and other planning, and increased capability and capacity of disaster coordination staffing.
The purpose of the Review of Seqwater and SunWater Warnings Communications was to examine Seqwater's and SunWater's flood release communications with the community and other stakeholders. The review explored the responsibilities and expectations of the community, the roles and responsibilities of involved entities, and communication processes and systems, including integration of dam warnings and notifications with the disaster management system at local, district and the state level. Timeliness and effectiveness of existing communication approaches were considered.
The basic elements of a system that can offer assurance were found to be present, however inconsistencies were identified in some of the legislation and principles that guide key stakeholder organisations with responsibilities for dam warnings.
Queensland Government agencies are on track to implement the recommendations of the report including review of legislation and guidelines to enhance communication and collaboration during disaster planning; improve and test warnings and notifications and to proactively engage with local government and the community on dam release scenarios.
The purpose of the Performance Review of the Flood Warning Gauge Network in Queensland was to evaluate the adequacy of the hydrometric gauge networks used for flood warning in Queensland in order to identify and prioritise potential areas of improvement.
The Performance Review found that gauging stations of varying technical standards had resulted in the reliability of data used for flood forecasting and warnings being of variable quality. There were no consistently applied standards for instrumentation, monitoring and data collection for gauges used for flood warning.
Queensland Government agencies are on track to implement the recommendations of the report focussing initially on local councils with very high and high priority settlements identified for improved flood warning infrastructure. Implementation includes validation of the outcomes of the state wide review with respective local councils and the formation of a cross-agency forum to oversee improvements in the strategic and operational arrangements of the Queensland flood warning gauge network.
Performance Review of Flood Warning Gauge Network in Queensland
Appendices
A - Glossary
B - Project Terms of Reference by DNRM
C - TOR Checklist
D - Settlement Maps
E - Priority determination methodology
F - Prioritisation results - summary
G - Prioritisation results - detailed
H - Compilation of known tech standards including title page
I - Gauge owners
J - Basin Maps
L - Flood Warning Network details by settlement
M - Travel time calculation by subbasin
O - Gauging site inspection checklist
P - Asset condition assessment
R - Flood Warning and evacuation
T - Settlements without gauge boards
V - Prioritisation of Settlements without a Flood Forecast Location
V - Prioritisation of Settlements without a Flood Forecast Location Part 2
Performance Review of the Flood Warning Gauge Network in Queensland
The purpose of the Performance Review of the Flood Warning Gauge Network in Queensland was to evaluate the adequacy of the hydrometric gauge networks used for flood warning in Queensland in order to identify and prioritise potential areas of improvement.
The Performance Review found that gauging stations of varying technical standards had resulted in the reliability of data used for flood forecasting and warnings being of variable quality. There were no consistently applied standards for instrumentation, monitoring and data collection for gauges used for flood warning.
Queensland Government agencies are on track to implement the recommendations of the report focussing initially on local councils with very high and high priority settlements identified for improved flood warning infrastructure. Implementation includes validation of the outcomes of the state wide review with respective local councils and the formation of a cross-agency forum to oversee improvements in the strategic and operational arrangements of the Queensland flood warning gauge network.
Performance Review of Flood Warning Gauge Network in Queensland
Appendices
A - Glossary
B - Project Terms of Reference by DNRM
C - TOR Checklist
D - Settlement Maps
E - Priority determination methodology
F - Prioritisation results - summary
G - Prioritisation results - detailed
H - Compilation of known tech standards including title page
I - Gauge owners
J - Basin Maps
L - Flood Warning Network details by settlement
M - Travel time calculation by subbasin
O - Gauging site inspection checklist
P - Asset condition assessment
R - Flood Warning and evacuation
T - Settlements without gauge boards
V - Prioritisation of Settlements without a Flood Forecast Location
V - Prioritisation of Settlements without a Flood Forecast Location Part 2
D - Settlement maps
|
J - Basin Maps
|
Archived Publications
|
Disaster Operations Activities January-June 2015
Disaster Operations Activities January-June 2014
Disaster Operations Activities July-December 2013
Disaster Operations Activities Jan-Jun 2012 *
Disaster Operations Activities Jul-Dec 2011 *
Disaster Operations Activities Jan-Jun 2011 *
Disaster Operations Activities Jul-Dec 2010 *
Disaster Operations Activities Jan-Jun 2010 *
Disaster Operations Activities Jul-Dec 2009 *
Disaster Operations Activities Jan-Jun 2009 *
These reports highlight disaster management activities undertaken during the relevant financial year together with details of disaster operations and information about priorities for disaster management.
State Disaster Management Group Annual Report 2013-2014 *
State Disaster Management Group Annual Report 2012-2013 *
State Disaster Management Group Annual Report 2011-2012 *
State Disaster Management Group Annual Report 2010-2011 *
State Disaster Management Group Annual Report 2009-2010 *
State Disaster Management Group Annual Report 2008-2009 *
State Disaster Management Group Annual Report 2007-2008 *
State Disaster Management Group Annual Report 2006-2007 *
State Disaster Management Group Annual Report 2005-2006 Part 1 * / Part 2 *
NDRRA/SDRA Activations 2012-2013
Longreach Floods, 18 February 2013 *
Central and Southern Queensland Low, 25 Feb - 5 March 2013 *
Tropical Cyclone Oswald and Associated Rainfall and Flooding, 21-29 January 2013 *
Barcoo Severe Storm, 15 January 2013 *
South West Queensland Wildfires - December 2012 *
Far Northern Queensland Bushfires, late October to December 2012
NDRRA/SDRA Activations 2011-2012
Localised Heavy Rainfall Northern Queensland, October 2011 *
East Coast Low, 22 March 2012 *
Heavy Rainfall & Flooding Northern & Far Northern Queensland 15 March 2012 *
North Coast Storms and Flooding and East Coast Hybrid Low 24 February 2012 - 7 March 2012 *
Tropical Low, Far Northern Queensland 3 - 4 February 2012 *
South East Queensland Heavy Rainfall and Flooding 23 -26 January 2012 *
Western Queensland Tropical Low 27 January - February 2012 *
Southern Queensland Flooding November-December 2011 *
Queensland Bushfires, August - November 2011 *
NDRRA/SDRA Activations 2010-2011
South West Flooding , April 2011 *
Queensland Monsoonal Flooding, 28 Feb - March 2011 *
Severe Tropical Cyclone Yasi, 2 February 2011 *
Queensland Flooding and Tropical Cyclone Tasha and Anthony, November 2010 - February 2011 *
South East Queensland Flooding, 9-12 October 2010 *
South West Queensland Low and Associated Flooding, September 2010 *
NDRRA/SDRA Activations 2009-2010
Qld Monsoonal Flooding & TC Olga & Neville, Ului and Paul, January to April 2010 *
Northern, Central and South West Queensland Flooding, 22 December 2009 to 8 January 2010 *
South West Qld Flooding, 20-25 November 2009 *
Queensland Bushfires, September - October, 2009 *
NDRRA/SDRA Activations 2008-2009
Tropical Cyclone Hamish, 5-11 March 2009 *
South East Queensland Low May 2009 *
Sunshine Coast, Gympie and Fraser Coast Flooding, April 2009 *
Tara Storms - 15 February 2009 *
Queensland Monsoonal flooding and Tropical Cyclones Charlotte and Ellie, January - February 2009 *
Queensland Storms & Associated Flooding November 2008 *
Baralaba Storms 7 December 2008 *
NDRA/SDRA Activations 2007-2008
South West QLD Flooding June 2008 *
SE QLD Storms 29 May - 2 June 2008 *
SE and Western Qld Storms and Flooding, 3-8 Feb 2008 *
Queensland Monsoonal Flooding, February / March 2008 *
Queensland Monsoonal Flooding, January 2008 *
South East Queensland East Coast Low 27 December 2007 - 7 January 2008 - NDRRA *
Central West Queensland Storms and Flooding 22-30 December 2007 - NDRRA *
South West Queensland Storms and Flooding 23-30 November 2007 - NDRRA *
South East & North Coast Qld East Coast Low August 07 - NDRRA *
Central & Southern Qld Severe Storms October 2007 - NDRRA *
Central & Southern Qld Severe Storms October 2007 - SDRA * (34 KB)
Archive
For older activations please email your request to: NDRRA@qldra.org.au
*This publication was produced prior to the current government.
In November 2013, the Queensland Government Statistician’s Office (QGSO) conducted the second Queensland Community Preparedness Survey (QCPS) to determine/measure levels of community preparedness at the beginning of the 2013-14 storm and cyclone season.
The inaugural QCPS was conducted by the QGSO in May 2013 to measure levels of community preparedness at the end of the 2012-13 storm and cyclone season. Copies of both the May 2013 and November 2013 QCPS full reports are available under General Publications.
The Queensland Strategy for Disaster Resilience acknowledges that building resilience is an ongoing responsibility of all Queenslanders. “If you do a little, we all accomplish a lot”. Community disaster resilience is dependent on individuals taking responsibility by actively undertaking measures to protect their lives and property such as: understanding their exposure to risks and planning and preparing for all hazards. To support individuals in their resilience and preparedness, both local and state governments have a legislated role (see Sections 23 and 30 of the Disaster Management Act 2003) in ensuring the community has an understanding of risks and hazards and to educate the community on ways to reduce risk from hazard exposure, vulnerability and impact.
The QCPS is designed to provide evidence on the preparedness levels of households in Queensland, at both state and regional levels. Survey findings provide emergency management stakeholders with crucial situational awareness of community levels of preparedness, relative to specific geographic and demographic areas of responsibility.
The QCPS data assists emergency management stakeholders to:
- monitor changes in respective levels of community preparedness over time;
- determine priority population segments requiring more targeted engagement and education approaches and to prioritise the strategic partnerships and interventions required;
- inform the development and approach to future state and local community education preparedness campaigns and the development of packages to support councils in priority areas; and
- determine appropriate messaging and strategies required to further influence community preparedness.
November 2013 Survey products
- A summary report on key findings and implications prepared by the Office of the Inspector-General Emergency Management.
- The full report : Queensland Community Preparedness Survey Report November 2013.
- Data graphs of Regional Results
Findings
Changes in preparedness levels since May 2013
There are two measures demonstrating a significant change, from the May 2013 Queensland Community Preparedness Survey (QCPS) results:
- The number of households that had prearranged for members to stay with family or friends in case of evacuation fell by 14% points (from 56.6% in May to 42.6% in November 2013).
- The proportion of households that had identified the strongest room in their home to shelter in during a severe storm or cyclone dropped by 3.3% points (from 73.5% in May to 70.3% in November).
Additional preparatory steps
Of the 27.7% of households that had taken new preparedness steps in the last 12 months (as at November 2013), 23.0% had taken additional steps beyond those specifically addressed in the questions that they believed had contributed to their preparedness. The most common of these steps included acquiring a generator; improving drainage on their premises; and/or purchasing gas or solar powered items.
There were no further significant changes to the findings at a state level from the May 2013 QCPS and the following findings are consistent for both the May and November 2013 surveys:
Queensland households believe they know their local risks from natural disasters (94.9%) and have taken basic steps to help minimise damage and cope with disasters (e.g. have building insurance (94.1% of those not renting), have a battery-operated torch or wind-up torch (91.6%), and have enough medications (93.3%) and food (90.4%) for three days);
- In reality, Queenslander’s responses to further questions show that they are not as prepared as they believe they are (e.g. significant numbers of households had not discussed and decided what to do if the home was at risk (52.6%), they had not developed and documented their household emergency plan (92.7%), had no access to a printed or hand written list of emergency contact phone numbers (49.5%) and had not stored essential items in an emergency kit (73.1%));
- Approximately 30% of Queensland households had taken some steps to be better prepared in the previous 12 months prior to the survey, mostly in response to recent disaster events;
- Complacency remains a key issue in the 10% of Queensland households who thought they were unprepared; and
- Cultural background, household tenure and type may affect how some people prepare.
Implications/Recommendations
Implications remain the same as for the May 2013 QCPS summary report, in that, future efforts need to maintain the focus on:
- Encouraging people to ‘Get Ready’, based on the risks they know they face (particularly household emergency planning for specific hazards);
- Households with children;
- Landlords and tenants of rental properties; and
- Households that usually speak languages other than English in the home.
Comparisons between May and November 2013 surveys
The results of the November 2013 survey indicate community preparedness levels have reduced significantly for two measures contributing to specific household emergency planning (i.e. arranging accommodation with family or friends in case of evacuation and having identified the strongest room to shelter in during severe storm or cyclone), whereas preparedness levels for basic preparedness measures remain relatively consistent to the May 2013 results.
At the state level, two preparedness measures demonstrated a statistically significant change from the May 2013 results:
- The number of households that had prearranged for household members to stay with family or friends in case of evacuation fell by 14% (from 56.6% in May to 42.6% in November 2013).
- The proportion of households that had identified the strongest room in their home to shelter in during a severe storm or cyclone dropped by 3.3% (from 73.5% in May to 70.3% in November)
At respective regional levels, slight variances in preparedness levels are demonstrated across the two surveys (see Figures 8 to 17 in the Summary Report , however only one preparedness measures demonstrated a statistically significant change from the May 2013 results:
- prearranged for household members to stay with family or friends in case of evacuation (eight regions demonstrated statistically significant decreases for this measure. See Table 1).
Table 1. Estimated percentage of households that had prearranged to stay with family or friends in case of evacuation:
regions that demonstrated statistically significant differences from May to November 2013.
| Region | May 2013 | November 2013 | Total change |
|---|---|---|---|
Far North Queensland | 66.6% | 45.0% | -21.6 |
South Brisbane | 60.4% | 39.8% | -20.6 |
Darling Downs | 56.8% | 38.2% | -18.6 |
Moreton | 61.4% | 44.2% | -17.2 |
North Brisbane | 52.8% | 37.5% | -15.3 |
South West | 61.1% | 45.9% | -15.2 |
Mackay | 59.6% | 45.5% | -14.1 |
Logan | 56.3% | 42.6% | -13.7 |
Conclusions and recommendations
As in the May 2013 survey summary report, the November 2013 results indicate further that future disaster and emergency management arrangements and resilience building activities need to move beyond encouraging general preparedness measures to encouraging more focused disaster readiness measures relative to local risks, such as:
- discussing and deciding, in advance, on what to do if the home is threatened by a natural disaster;
- documenting household emergency plans that detail what to do, where to go, who to contact; and
- if residing in evacuation or flood zones, pre-arranging to stay with family or friends located in safer locations.
The November 2013 results further indicate that specific effort is required to focus on those demographic groups demonstrating lower preparedness levels, including:
- households with children;
- landlords and tenants of rental properties, both public and private; and
- households that usually speak languages other than English in the home.
In May 2013, the Government Statistician’s office conducted the first Queensland Community Preparedness Survey, a standalone questionnaire specifically designed to meet the data requirements of the Queensland Disaster Management Sector.
Survey products available:
- A summary report on key findings and implications prepared by the Office of Inspector General Emergency Management.
- The full report : Queensland Community Preparedness Survey Report May 2013.
- Data Graphs of Regional Results
FINDINGS
- Queensland households believe they know the local risks from natural disasters and take basic steps to help cope with disasters (e.g. have building insurance; have a battery operated torch and radio; and have enough medications and food for three days);
- In reality Queenslander’s responses show that they are not as prepared as they believe they are (e.g. they had not discussed what to do if the home was at risk; they had not developed and documented their household emergency plan; they had no access to a hard-copy list of emergency contact phone numbers);
- Approximately 30% of Queensland households had taken some steps to be better prepared in the previous 12 months prior to the survey, mostly in response to recent disaster events (Note: these results are not comparable with 2012 results. Refer to the Full Report (pages 30 and 49) for details);
- Complacency remains a key issue in the 10% of Queensland households who thought they were unprepared;
- Cultural background, household tenure and type may affect how some people prepare; and
- South East Queensland households generally demonstrated lower levels of preparedness than other regions in the state.
IMPLICATIONS
Implications are for future efforts to focus on:
- Encouraging people to ‘Get Ready’, based on the risks they know they face;
- Households with children;
- Landlords and tenants of rental properties; and
- Households that usually speak languages other than English in the home.
In May 2013, Emergency Management Queensland (EMQ) commissioned the Queensland Community Preparedness Survey (QCPS) to measure community preparedness for natural disasters. The Government Statistician’s office collected similar information as part of the 2012 Queensland Regional Household Survey (QRHS).
The 2013 QCPS is specifically designed to better meet the needs of disaster management and resilience officials, in particular the District Disaster Management Groups (DDMGs), Local Disaster Management Groups (LDMGs) and local councils. As such, changes were made to the QCPS instrument, including:
- Making the survey more regionally specific, by increasing the data sets from 10 to 15, to align with the new 15 Queensland Police Service Districts (in effect 1 July 2013).
- Improving levels of data accuracy via changes to survey respondent selection and question design.
The sampling difference and changes to questions, between the 2012 QRHS and the 2013 QCPS, means that direct comparisons between years are not possible, except where explicitly stated.
METHOD
In May 2013, the Government Statistician’s office conducted the first Queensland Community Preparedness Survey, a standalone questionnaire specifically designed to meet the data requirements of the Queensland Disaster Management Sector.
The survey used up to 21 questions to collect information in the areas of:
- disaster risk management;
- disaster preparedness;
- motivation to prepare for natural disasters; and
- household demographics.
The survey was conducted by telephone, and resulted in 3,934 useable responses. The response rate for the survey was 50.0%. This report and the QCPS May 2013 full report present comparisons with baseline (2012) QRHS data where appropriate.
SUMMARY OF RESULTS - STATE-LEVEL
Queensland households still believe they know their local risk
A large majority of Queensland households felt they had:
- a good understanding of the types of natural disasters that could occur in Queensland and the chances of them occurring (98%); and
- a good understanding of how a disaster might impact their local area (95%).
Queenslanders continue to over-estimate their preparedness when it comes to household disaster planning
Figure 1: Estimated percentage of households that had taken specific preparedness measures
Almost three quarters (73%) of Queensland households believed they were either prepared or very prepared for a natural disaster and the majority of households had taken more general preparedness measures. However, responses to questions about more focussed disaster preparedness measures show lower preparedness:
- 92% did not have a documented emergency plan, an increase from 89% in 2012;
- 73% did not keep emergency items stored as an emergency kit;
- 59% did not include a household member with a current first aid certificate;
- 44% had not discussed / decided what they would do if their home was at risk from storms, cyclones, flooding or bushfire;
- 43% had not pre-arranged to stay with family or friends in case they needed to evacuate their home;
- 41% did not have access to a hard-copy list of disaster-related emergency contact phone numbers (like the SES, local council, neighbours, energy provider, family/household contacts etc.); and
- 39% would not have enough drinking water to last three days, an increase from 34% in 2012.
Figure 1 above shows further detail on households’ preparedness measures.
Approximately 30% of Queensland households had undertaken new preparedness measures in the previous 12 months
Almost three in ten Queensland households had undertaken one or more of the disaster preparedness measures addressed in the survey, for the first time in the 12 months prior to the survey. Of those that had taken new steps, the most common steps taken were:
- discussing / deciding what to do if the home was at risk (18%);
- identifying the strongest room in the home (16%);
- preparing a list of emergency contact numbers (16%);
- having enough food to last three days (16%); and
- stored enough drinking water to last three days (15%).
Respondents who had taken new preparedness actions were asked what had prompted them to do so (multiple responses were allowed). The most common reasons were categorised as being due to ‘recent local events’ (25%), ‘recent Queensland disasters not affecting you/your household’ (24%), and ‘recent disasters you/your household have personally experienced’ (24%).
Complacency remains as an ongoing barrier to preparedness
Approximately 10% of households self-reported to be unprepared or not at all prepared for a natural disaster. Of those, 37% had not thought about preparing for a natural disaster, and 33% felt they were unlikely to be affected.
Cultural background may affect the type of preparedness measures taken by Queensland households
The responses to a number of questions illustrated statistical differences between households that usually spoke English at home and households that usually spoke a language other than English (LOTE). In the majority, English speaking household responses were consistently higher than LOTE, with one exception, that LOTE households were more likely to have implemented one or more new preparedness measures in the previous 12 months (see Figure 2).
Household tenure and type may affect the types of preparedness and planning measures taken by Queensland households
The range of household types and the range of household tenures demonstrated significant differences in preparedness measures taken by households. These differences were found between:
- owner-occupied households and households that rent (see Figure 3);
- households with children and those without children (see Figure 4); and
- multi-person households and single-person households (see Figure 5).
Figure 2: Estimated percentage of households by language that had taken specific preparedness measures 
Household tenure
Owner-occupied households showed higher levels of preparedness compared to households that rent, with one exception; households in rented accommodation demonstrated higher percentages for implementing new preparedness measures in the last 12 months (see Figure 3).
Figure 3: Estimated percentage of households by tenure that had taken specific preparedness measures 
Household type
Households without children demonstrated higher levels of preparedness measures compared to households with children, with two exceptions; households with children were more likely to include a member with a current first aid certificate, and more likely to have taken some new measure in the previous 12 months (see Figure 4).
Figure 4: Estimated percentage of households by type (with and without children) that had taken specific measures
Statistical differences were found between single households and multi-person households across a range of preparedness measures. Multi-person households were more likely to implement household protection measures (such as securing outdoor items, having current insurance etc.) whereas single person households were more likely to implement preparedness planning measures (such as deciding what to do if home is at risk, pre-arranging accommodation in case of evacuation and developing a documented household emergency plan etc.). See Figure 5 for further details.
Figure 5: Estimated percentage of households by type (single person and multi-person) that had taken specific measures
Higher socio-economic households are generally more likely to have first aid kits, but less likely to have documented emergency plans or emergency numbers
Annual household income appeared to be positively associated with some preparedness measures, and negatively associated with others. For example, households earning $110,000 or more were more likely to have a first aid kit than households earning less than $23,000, but less likely to have a documented emergency plan or a list of emergency numbers.
SUMMARY OF RESULTS REGIONAL-LEVEL
The QCPS 2013 methodology increased the regional datasets to 15, providing greater detail at a regional level. Figure 6 depicts the number of responses per region, ranging from 251 (Ipswich, Mackay) to 288 (North Brisbane). The 15 regional datasets align with the new Queensland Police Service Districts (in effect 1 July 2013). The 2012 QRHS survey utilised ten regional datasets aligned with the SA4 Australian Bureau of Statistics statistical areas.
Figure 6: Map of regions indicating the number of survey responses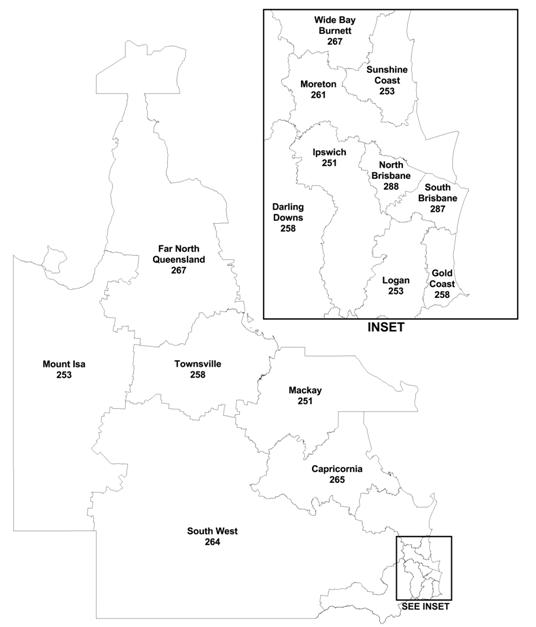
South East Queensland households were generally less prepared than other regions in the state
Households in South East Queensland Regions generally demonstrated lower levels of preparedness than the rest of the state across the following measures:
- self-assessing their level of disaster preparedness as ‘very prepared’ or ‘prepared’ (See Figure 7);
- to have had enough food for three days (See Figure 8);
- to have had enough drinking water for three days (See Figure 9);
- kept preparedness items as an emergency kit (See Figure 10)
- checked their roof for damage or weakness (See Figure 11).
- identified the strongest room in their home (See Figure 12);
- discussed and decided what they would do if their home was at risk (See Figure 13); and
- made arrangements for members to stay with family or friends (See Figure 14).
Figure 7: Regional results – estimated proportion of households that believed they were prepared or very prepared
Figure 8: Regional results – estimated proportion of households that considered they would have enough food for three days, if cut off from services without warning
Figure 9: Regional results – estimated proportion of households that considered they would have enough drinking water for three days, if cut off from services without warning
Figure 10: Regional results – estimated proportion of households that kept preparedness items as an emergency kit
Figure 11: Regional results – estimated proportion of households that have checked their roof for damage or weakness
Figure 12: Regional results – estimated proportion of households that have identified the strongest room in their home
Figure 13: Regional results – estimated proportion of households that have decided what they would do if their home was at risk from storms, cyclone, flooding or fire
Figure 14: Regional results – estimated proportion of households that have pre-arranged for members to stay with family or friends if evacuation is required
IMPLICATIONS
The results of this survey indicate that future disaster and emergency management arrangements and resilience building activities should concentrate effort on:
- Households with children;
- Landlords and tenants of rental properties, both public and private; and
- Households that usually speak languages other than English in the home.
Future efforts need to move beyond encouraging general preparedness measures (such as have a torch, radio, food etc.) to encouraging more focused disaster readiness measures that relate to local risks, such as:
- Discussing and deciding on what to do if home is threatened by natural hazard;
- Documenting household emergency plans detailing what to do, where to go, who to contact; and
- If residing in evacuation or flood zones, pre-arranging to stay with family or friends located in safer locations.
The Government Statistician within the Department of Treasury and Trade, conducts regular population surveys that collect information from a representative sample of Queensland adults to generate population estimates at regional and state levels.
Emergency Management Queensland (EMQ) included questions in the May 2012 Queensland Regional Household Survey (QRHS) to ask people what preparations their households had made for a natural disaster.
This information helps determine how prepared Queensland households are for natural disasters. This information can also be used to find out which types of households are the most and least prepared, and to monitor changes over time.
Survey products available:
- A summary report: Household Preparedness for Natural Disasters
- The full report: QRHS May 2012 EMQ Survey Report
- Data graphs for regional results (Note: Regions used within this document align with the Statistical Area 4 regions – from the Australian Statistical Geography Standard)
Summary of results
State Results
Queensland households believe they know their risk
- 97% of households believed they have a good understanding of the types of natural disasters that could occur in Queensland and the chances of them occurring; and
- Almost all households (95%) thought they had a good understanding of the impacts from a natural disaster.
While the survey did not test the accuracy of respondents’ knowledge, the results indicate a broad-based understanding that natural disasters are a threat for Queensland communities.
Queenslanders tend to over-estimate their preparedness
Three-quarters (76%) of respondents believed they are prepared or very prepared for a natural disaster, but their responses to more detailed questions on preparedness suggested otherwise:
- 89% of respondents did not have a documented household emergency plan;
- 73% of respondents did not have their emergency provisions stored in an emergency kit;
- 56% reported that no-one in their household had a current first aid certificate;
- 41% of respondents had not discussed what to do if at risk of a storm, cyclone, flooding or bushfire;
- 40% did not have a list of emergency phone numbers;
- 34% of respondents would not have enough drinking water in the event of being cut off from essential services; and
- 18% believed they are inadequately insured.
See Figure 1 for further detail on percentage of specific preparedness measures taken.
Figure 1. Percentage of respondents having taken specific preparedness measures
7 per cent of Queensland households had taken new preparedness measures in the last 12 months
Respondents who had implemented new preparedness measures in the last 12 months (as at May-June 2012) were asked which actions were implemented (multiple responses were allowed). The most common new measures implemented were:
- Cleaning out gutters, drains and flood channels (31%);
- Trimming trees away from homes and powerlines (27%); and
- Maintaining enough food for three days in the event of being cut off from essential services (25%).
Multi-person households with children (11.3%) were more likely than multi-person households without children (5%) and single person households (5%) to have implemented new actions. Similarly, households with an annual income of at least $110,000 were more likely (9%) than households with an annual income of less that $23,000 (4%) to have implemented new measures.
Complacency is an ongoing barrier to disaster preparedness
Respondents who indicated they were unprepared were asked what had prevented them and their household from taking steps to prepare (multiple responses were allowed). The key barriers to taking action were explained as have not thought about it (36%) and unlikely to happen to us (28%).
Respondents who had taken preparedness actions were asked what had prompted them to do so (multiple responses were allowed). The most common reasons were it is something we have always done (30%), recent Queensland disasters (28%), common sense (25%) and personal experience of disaster (23%).
Socio-economic status influences insurance uptake and first aid certification
Households with higher income levels were more likely to have first aid certification and insurance (consistent across all insurance types – building insurance, contents insurance and renters insurance).
Individuals’ assessment that they are adequately insured against natural disasters generally increased consistently with age.
Cultural background affects the type of preparedness actions by Queensland households
Households that usually speak English at home were more likely than those who usually speak a language other than English to have:
- A good understanding of natural disasters (98% and 92% respectively);
- Adequate supplies of medications (93% and 86% respectively);
- Contents insurance (83% and 70% respectively); and
- A belief that they are adequately insured against natural disasters (73% and 59% respectively).
Households that usually spoke a language other than English at home were more likely than those who usually speak English to have:
- An emergency kit (38% and 26% respectively) and
- Made accommodation arrangements in case of evacuation (69% and 52% respectively).
Regional Results
Regions used within this report align with the SA4 ABS statistical areas (as used in collection and presentation of census data). Figure 2 depicts the regional areas used within this report and Table 1 details the sample sizes for each region.
Table 1. Map of QRHS / SA4 regions.
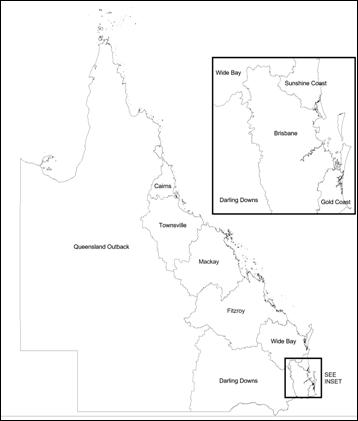
Figure 2. Sample achieved across all QRHS regions.
North Queensland households regarded themselves as better prepared than those in the South East
The survey results demonstrated a divide between the North and South East of the state, with households in the North (and Queensland Outback) consistently demonstrating higher levels of preparedness compared with those in South East Queensland (SEQ) across the following measures:
- Believed they are very prepared or prepared (see Figure 3);
- Arranged accommodation with family and friends if evacuation required (see Figure 4);
- Identified strongest room in the home (see Figure 5);
- Discussed what to do if their home is at risk of storm, cyclone, flooding or fire (see Figure 6);
- Had items stored as an emergency kit (see Figure 7); and
- Had enough drinking water if cut off from services (see Figure 8).
However, households within Mackay (85%), Darling Downs (84%), Brisbane (84%) and the Sunshine Coast (83%) were more likely to have contents insurance than Cairns households (72%).
No significant difference in whether households had building insurance was found between regions.
Figure 3. Regional results – percentage of adults who believed they were prepared or very prepared.
Figure 4. Regional results – percentage of households that had arranged accommodation with family and friends if evacuation required.
Figure 5. Regional results – percentage of households that had identified the strongest room in their home to shelter in during a severe event (storm and cyclone).
Figure 6. Regional results – percentage of households that had discussed what to do if their home were at risk from storm, cyclone, flooding or fire.
Figure 7. Regional results – percentage of households that had emergency provisions stored in an emergency kit.
Figure 8. Regional results – percentage of households that had enough drinking water (for 3 days) if cut off from essential services.
*This publication was produced prior to the current government.